Portfolio
A look at the dashboards and tools we’ve built.
Each application below is a working example built for real analytical workflows. Click through to explore the live versions.
Pharmaceutical Release Testing Dashboard
A multi-tab analytics platform for pharmaceutical QC laboratories. Combines statistical control charting, predictive forecasting, and risk-based decision support in a single workflow.
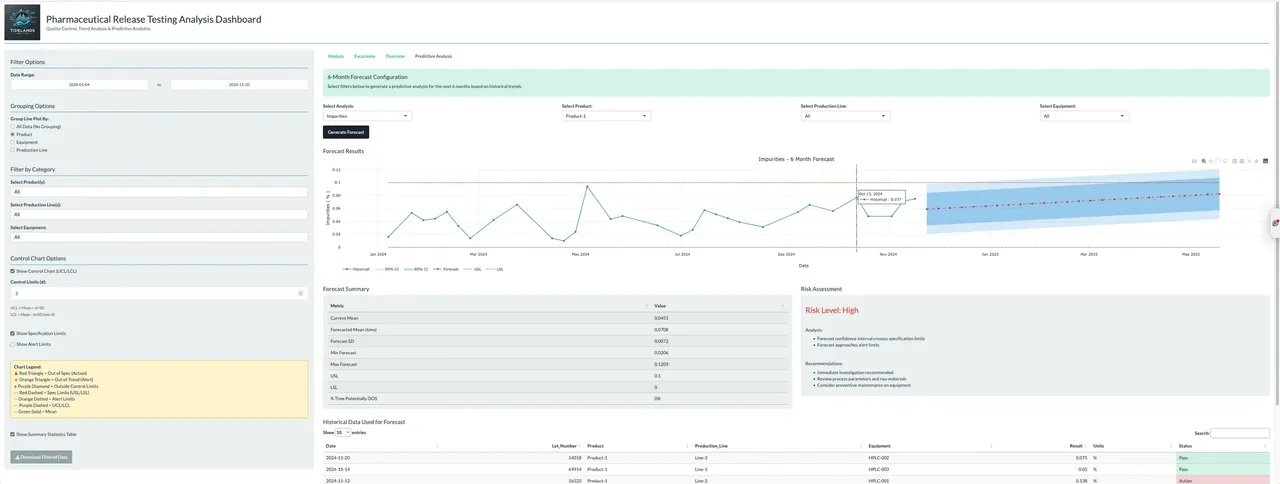
Predictive Analysis Forecasts upcoming results based on historical trends, with automatic risk classification.
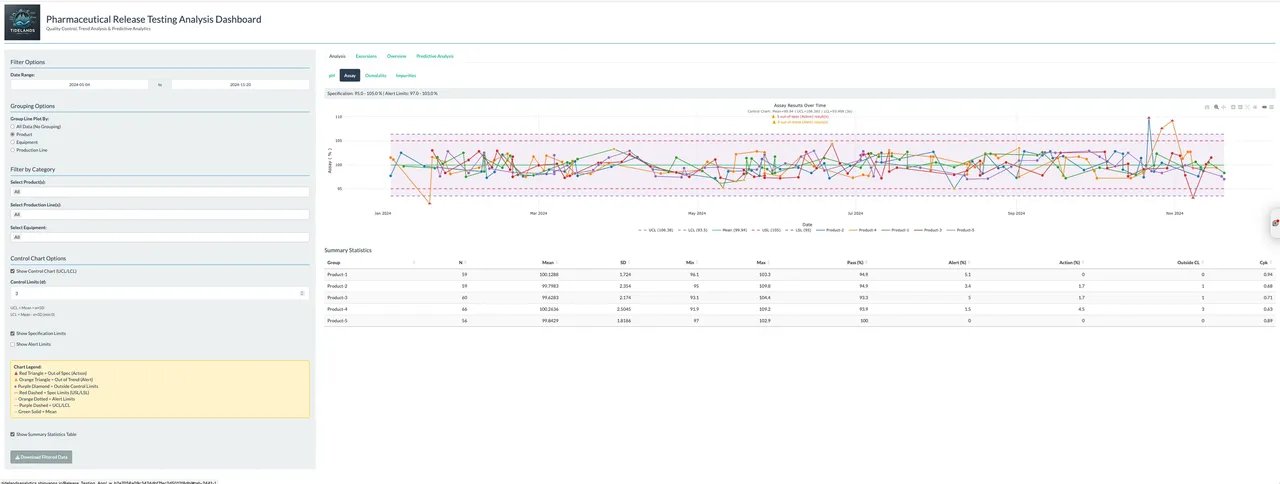
Assay Control Charts Time-series control charting with UCL/LCL limits, specification bands, and product-level statistics.
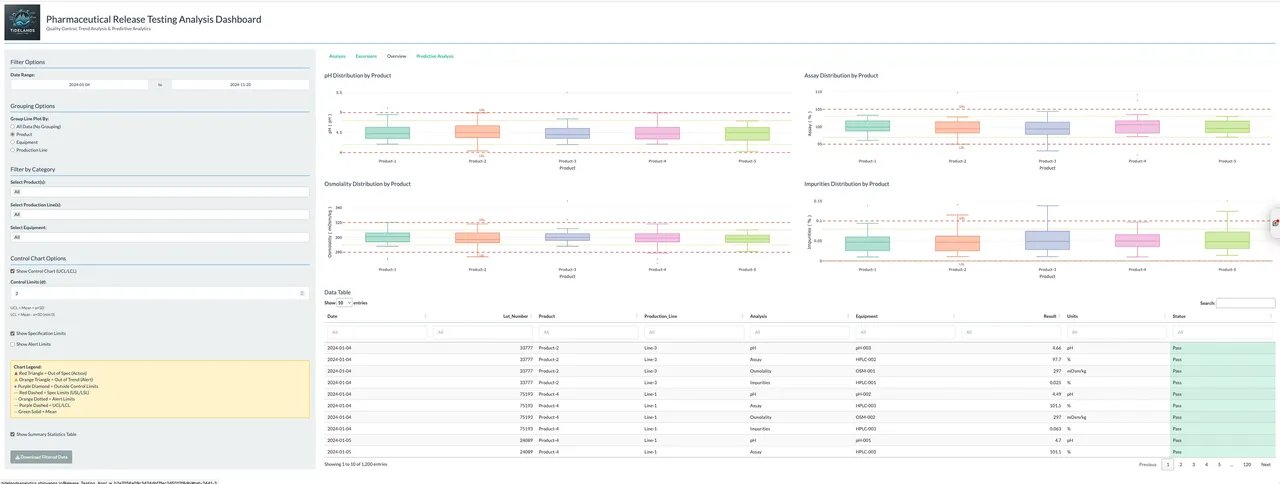
Distribution Analysis Comparative distributions across products and analytes, with searchable underlying data tables.
Try it live
Explore the working dashboard with sample pharmaceutical QC data.
Built with: R · Shiny · Plotly · DT · forecast
Microbial Monitoring Dashboard
Environmental monitoring platform for cleanroom and production facilities. Tracks organism counts, contamination rates, and excursion patterns across multiple buildings.
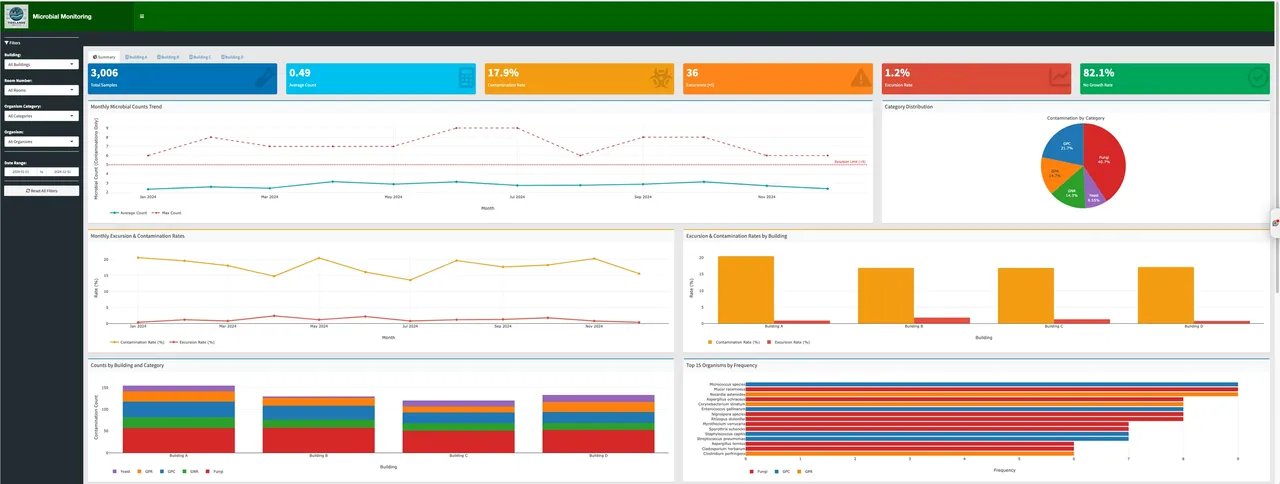
At a glance
- Real-time KPI cards (sample counts, contamination rates, excursion alerts)
- Monthly trending with excursion limit overlays
- Building-by-building comparisons
- Top-N organism frequency analysis
- Category-level distribution charts
Built with: R · Shiny · ggplot2 · Plotly · bslib
Production Review
A production monitoring dashboard for tracking manufacturing metrics and operational performance.
Want something like this for your data?
Whether you’re starting from spreadsheets or have years of data sitting in a database, we can help you turn it into something your team will actually use.